A Few Thank-Yous
To every customer who trusted us with their redirect mapping, every agency that made us part of their workflow, and every person who shared feedback: thank you. You made year one possible.
In particular, these folks put fuel in our tank in many different ways:
- Power Digital, our first agency client for the web app, who made us smile just by using the product after every week we pushed updates
- Sparky, the Shopify Design, Development, and CRO Agency, an awesome team who cheered us on all year long
- MetaMonster, a tool that helps you build and fix on-page SEO fundamentals, for valuable ICP discussions and honest feedback that saved us from bad ideas
- Shoplift, who shared our Shopify app posts and announcements with their network and users
The Year in Milestones
Our year started strong thanks to a big push right before it began. We filed a patent, launched our alpha, and made our first sale all in December 2024. That momentum carried us through the year.
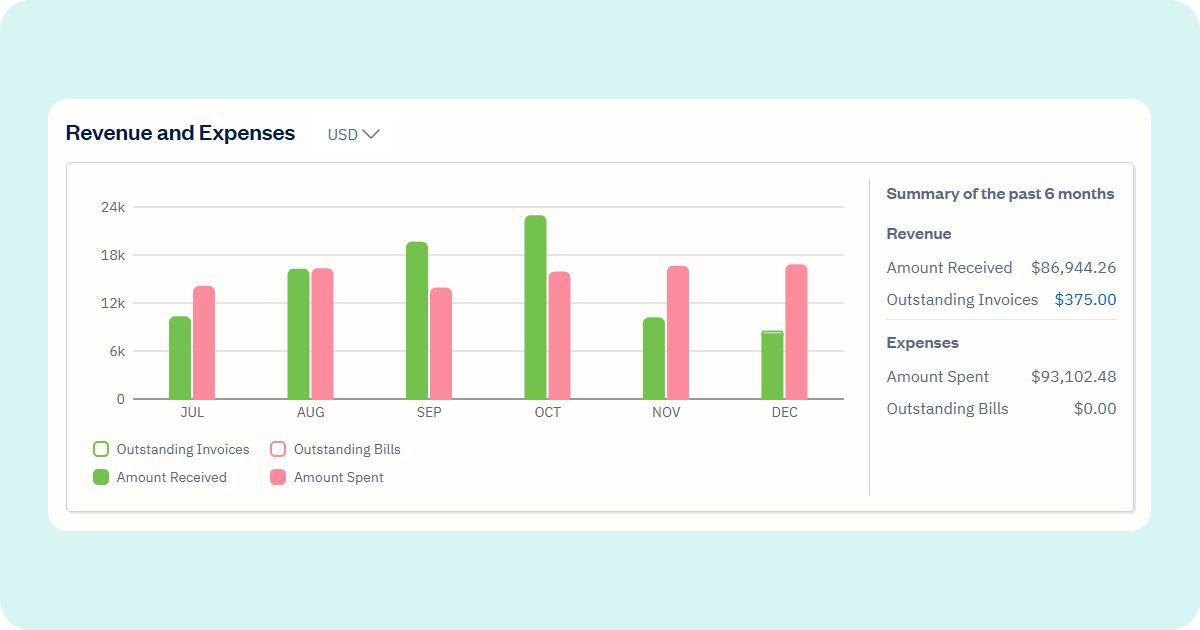
Year One Financials for Transparency
Here’s our complete financial picture from our first year building Redirects.net. We’re sharing this for other bootstrapped founders who might find real numbers helpful.
How We Spent Our Product Development Time
| Category | Hours | % of Total |
|---|---|---|
| Development | 1,455 | 53.79% |
| UX Design | 690 | 25.51% |
| Sales & Demos | 240 | 8.87% |
| Marketing | 160 | 5.91% |
| Content Creation | 160 | 5.91% |
| Total | 2,705 | 100% |
That’s over 2,700 hours invested in building two products: the Fast Match web application and our Shopify app. These are the minimum hours that have been tracked or paid. Realistically, there’s probably a 15% margin of untracked time from team discussions, planning sessions, and decisions we made along the way.
The Team
- 1 full stack developer
- 1 UX/UI designer
- 1 founder leading sales, marketing, and content creation
The Numbers
Revenue
Total Income: $142,945.57
| Category | Amount | % of Income |
|---|---|---|
| App Sales (Redirects.net) | $1,002.00 | 0.70% |
| Consulting Services | $145,422.75 | 101.73% |
| Charged Back Expenses | $565.51 | 0.40% |
| Discounts (Consulting) | -$4,044.69 | -2.83% |
| Net Revenue | $142,945.57 | 100% |
Our app diretly generated $1,002 in year one.
Our consulting work focused on helping brands with broader website migration strategy, the exact problem Redirects.net plugs into. Every client engagement taught us something new about the pain points, edge cases, and workflows that our customers face. We weren’t just funding development; we were conducting paid research.
The $4,000+ in discounts were applied to consulting invoices, helping us maintain relationships with clients who became valuable sources of product feedback.
Expenses
Total Expenses: $140,177.51 (98.06% of revenue)
Here’s where the money went:
The Big Three: Building the Product (74% of expenses)
| Category | Amount | % of Income |
|---|---|---|
| Contractors for Consulting Services | $55,581.46 | 38.88% |
| App Development | $47,298.00 | 33.09% |
| SaaS Tool Subscriptions | $17,866.11 | 12.50% |
Nearly three-quarters of our expenses went directly into building and maintaining the product.
Contractors ($55,581): Our largest expense. We relied on contractors to handle consulting work, creating a profit margin we could reinvest into app development.
App Development ($47,298): Direct development costs including specialized development work and technical consulting.
SaaS Tool Subscriptions ($17,866): Cloud services, development tools, analytics, and customer support software.
Infrastructure & Operations
| Category | Amount | % of Income |
|---|---|---|
| Hosting | $5,544.04 | 3.88% |
| Hardware | $3,301.91 | 2.31% |
| Bank Fees | $2,381.63 | 1.67% |
Hosting ($5,544): Servers, CDN, and cloud infrastructure.
Hardware ($3,301): Equipment purchases.
Bank Fees ($2,381): Stripe fees, wire transfers, and currency conversions.
Growth & Marketing
| Category | Amount | % of Income |
|---|---|---|
| Marketing | $1,455.78 | 1.02% |
| Advertising | $789.15 | 0.55% |
Marketing ($1,456) and Advertising ($789): Combined, just 1.57% of revenue. We focused on organic growth and content marketing.
Travel & Team
| Category | Amount | % of Income |
|---|---|---|
| Hotel/Lodging | $3,379.20 | 2.36% |
| Airfare | $817.00 | 0.57% |
| Meals & Entertainment | $600.68 | 0.42% |
| Taxi & Parking | $95.00 | 0.07% |
Travel ($4,291 total): We attended two industry events: Women in Tech SEO Fest in Portland, Oregon in April and Tech SEO Connect in Durham, North Carolina in December.
Other Operating Costs
| Category | Amount | % of Income |
|---|---|---|
| Education & Training | $574.38 | 0.40% |
| Subscriptions/Memberships | $184.05 | 0.13% |
| Accounting | $90.00 | 0.06% |
| Reference Materials | $134.65 | 0.10% |
| Taxes & Licenses | $55.00 | 0.04% |
| Interest | $29.47 | 0.02% |
The smaller expenses that kept things running.
The Year One Bottom Line
Net Profit: $2,768.06 (1.94% net margin)
With the core product built, year two is about sales, product evangelism, and finding our ideal customer fit.